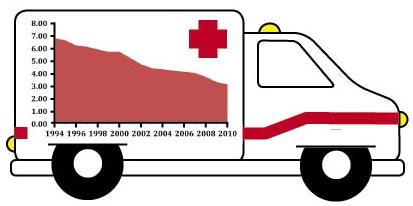
The efforts of OSHA and its partners in state and local governments to ensure the safety and health of America’s workers has played a major role in the more than 50 percent decline in private sector workplace injuries and illnesses from 6.8 million in 1994 to 3.1 million in 2010.
Title: Decline in private sector workplace injuries and illnesses
Content:
Chart Type: Line Plot
Chart Elements: 9 plots - 1994, 1996, 1998, 2000, 2002, 2004, 2006, 2008 and 2010 with the total number of private sector workplace injuries and illnesses in millions.
Private sector workplace injuries and illnesses in millions.
1994 = 6.8
1996 = 6.2
1998 = 5.9
2000 = 5.7
2002 = 4.7
2004 = 4.3
2006 = 4.1
2008 = 3.7
2010 = 3.1