Annual Partnership Evaluation Report
| Partnership Name | ||
|---|---|---|
The International Union, United Automobile, Aerospace and Agricultural Implement Workers of America (UAW), the Ford Motor Company (Ford), and Automotive Component Holdings, LLC (ACH) |
||
Purpose of Partnership |
||
The partners agree to construct an OSHA Strategic Partnership (OSP) based on mutual respect and trust that leverages the resources of all the parties through the systematic anticipation, identification, evaluation and control of health and safety hazards at UAW/Ford and UAW/ACH locations under federal jurisdiction. |
||
Goal of Partnership |
||
Goal |
Strategy |
Measure |
Reduce injuries and illnesses year-over-year at each OSP location |
|
|
Anticipated Outcomes |
||
|
||
Strategic Management Plan Target Areas (check one) |
|||
Construction |
|
Amputations in Manufacturing |
|
General Industry |
X |
|
|
Strategic Management Plan Areas of Emphasis (check all applicable) |
|||
Amputations in Construction |
|
Oil and Gas Field Services |
|
Blast Furnaces and Basic Steel Products |
|
Preserve Fruits and Vegetables |
|
Blood Lead Levels |
|
Public Warehousing and Storage |
|
Concrete, Gypsum and Plaster Products |
|
Ship/Boat Building and Repair |
|
Ergo/Musculoskeletal |
X |
Silica-Related Disease |
|
Landscaping/Horticultural Services |
|
|
|
Section 1 General Partnership Information
| Date of Evaluation Report |
|
||||||||
|---|---|---|---|---|---|---|---|---|---|
| Evaluation Period: | |||||||||
Start Date |
01/01/2010 |
End Date |
12/31/2010 |
||||||
Evaluation OSHA Contact Person |
Christian Wojnar |
||||||||
Originating Office |
Directorate of Cooperative and State Programs (DCSP), Office of Partnerships and Recognition (OPR), Washington, DC |
||||||||
Partnership Coverage |
|||||||||
# Active Employers |
12 |
# Active Workers |
15,194 |
||||||
Industry Coverage (note range or specific SIC and NAICS for each partner) |
|||||||||
Partner |
SIC |
NAICS |
|||||||
Buffalo Stamping Plant, Hamburg, New York (BSP) |
3465 |
336370 |
|||||||
Chicago Assembly Plant, Chicago, Illinois (CAP) |
3711 |
336111 |
|||||||
Chicago Stamping Plant, Chicago, Illinois (CSP) |
3465 |
336370 |
|||||||
Cleveland Casting Plant, Brook Park, Ohio (CCP) |
3353 |
331315 |
|||||||
Cleveland Engine Plant #1, Brook Park, Ohio (CEP1) |
3714 |
336312 |
|||||||
Cleveland Engine Plant #2, Brook Park, Ohio (CEP2) |
3714 |
336312 |
|||||||
Kansas City Assembly Plant, Kansas City, Missouri (KCAP) |
3711 |
336111 |
|||||||
Lima Engine Plant, Lima, Ohio (LEP) |
3714 |
336312 |
|||||||
Ohio Assembly Plant, Avon Lake, Ohio (OAP) |
3711 |
336111 |
|||||||
Sandusky Plastics Plant, Sandusky, Ohio (ACH) (SPP) |
3089 |
326199 |
|||||||
Sharonville Transmission Plant, Sharonville, Ohio (STP) |
3714 |
336350 |
|||||||
Walton Hills Stamping Plant, Walton Hills, Ohio (WHSP) |
3465 |
336370 |
|||||||
Section 2 Activities Performed
| Note whether an activity was provided for by the OSP and whether it was performed | ||
|---|---|---|
|
Required |
Performed |
a. Training |
YES |
YES |
b. Consultation Visits |
NO |
NO |
c. Safety and Health Management Systems Reviewed/Developed |
YES |
YES |
d. Technical Assistance |
NO |
NO |
e. VPP-Focused Activities |
NO |
NO |
f. OSHA Enforcement Inspection |
NO |
YES |
g. Offsite Verifications |
NO |
NO |
h. Onsite Non-Enforcement Interactions |
YES |
NO |
i. Participant Self-Inspections |
YES |
YES |
j. Other Activities |
NO |
NO |
| 2a. Training (if performed, provide the following totals) | |
|---|---|
Training sessions conducted by OSHA staff |
0 |
Training sessions conducted by non-OSHA staff |
* |
Employees trained |
15,194 |
Training hours provided to employees |
* |
Supervisors/managers trained |
* |
Training hours provided to supervisors/managers |
* |
Comments/Explanations (briefly describe activities, or explain if activity provided for but not performed) |
|
The training modules listed below are available to all employees who work in participating plants and in those areas affected by the training topics. For example, there would be no need for all plant employees to take training about hexavalent chromium as not all plant employees are potentially exposed to hexavalent chromium. Training by computer, allowing workers to proceed at their own pace, is becoming a staple at all of the Ford and ACH sites in lieu of training led by a trainer. Ford and ACH offer training on a wide variety of topics and those relevant to the protocols of the OSP, and those offered in 2010 are listed below:
*In 2010, Ford did not track the number of sessions and hours of training its employees and supervisors received due to the nature of the training provided as it allows each employee to complete at his own pace. Also, Ford did not track the number of employees and supervisors that received the training, but all of its employees at all of its sites performed at least one training session. |
|
| 2c. Safety and Health Management Systems (if performed, provide the following total) | ||
|---|---|---|
Systems implemented or improved using the 1989 OSHA Safety and Health Program Management Guidelines as a model |
12 |
|
Comments/Explanations (briefly describe activities, or explain if activity provided for but not performed) |
||
Corporate-Wide Improvements:
|
||
2f. OSHA Enforcement Activity (if performed, provide the following totals for any programmed, unprogrammed, and verification-related inspections) |
||
OSHA enforcement inspections conducted |
5 |
|
OSHA enforcement inspections in compliance |
2 |
|
OSHA enforcement inspection with violations cited |
3 |
|
Average number of citations classified as Serious, Repeat, and Willful |
.67 |
|
Comments/Explanations (briefly describe activities, or explain if activity provided for but not performed) |
||
Buffalo Stamping Plant Kansas City Assembly Plant Kansas City Assembly Plant Ohio Assembly Plant Kansas City Assembly Plant |
||
| 2h. Onsite Non-Enforcement Verification (if performed, provide the following total) | |
|---|---|
Onsite non-enforcement verifications performed |
0 |
Comments/Explanations (briefly describe activities, or explain if activity provided for but not performed) |
|
Due to the expiration of the OSP Agreement on November 9, 2009, the Area Offices did not conduct onsite non-enforcement verifications (OSHA Day events) during the evaluation period and the renewal discussions were ongoing during 2010. |
|
| 2i. Participant Self-Inspections (if performed, provide the following total) | |
|---|---|
Self-inspections performed |
4,044* |
Hazards and/or violations identified and corrected/abated |
N/A* |
Comments/Explanations (briefly describe activities, or explain if activity provided for but not performed) |
|
The following inspections are done on a regular basis at the OSP sites:
*The number of self-inspections performed is an estimate based on the frequency of each inspection times the number of facilities in the OSP. Also, Ford did not track the number of hazards corrected and/or abated. |
|
Section 3 Illness and Injury Information
|
OSP Totals |
|
|
|
|
|
|
Year |
Hours |
Total Cases |
TCIR |
DART Cases |
DART |
LTCR Cases |
LTCR |
2008 |
29,035,320 |
1,922 |
13.2 |
406 |
2.8 |
113 |
0.8 |
2009 |
24,131,772 |
1,681 |
13.9 |
403 |
3.3 |
115 |
1.0 |
2010 |
27,783,192 |
1,755 |
12.6 |
395 |
2.8 |
120 |
0.9 |
Total |
80,950,284 |
5,358 |
|
1,204 |
|
348 |
|
Three-year Rate (2008-2010) |
13.2 |
|
3.0 |
|
0.9 |
||
Comments |
*For all comparisons with the 2010 injury and illness rates involving Bureau of Labor Statistics (BLS) industry averages, the 2009 reported average rates were used.
The information provided below is a summary of each site’s performance and overall OSP averages. For additional site information including individual incidence rates and the 2009 BLS Industry Averages, see Appendix A: Individual Site Summaries.
2010 Results
- In 2010, the OSP participating sites decreased their TCIR by 9 percent, from 13.9 in 2009 to 12.6
- The sites’ TCIR rates, on the average, were 77 percent above their respective industry averages
- 2009: 73 percent below
- 50 percent of the sites reduced their TCIR
- One site had its TCIR below its industry’s average
- In 2010, the OSP participating sites decreased their DART rate by 15 percent, from 3.3 in 2009 to 2.8
- The sites’ DART rates, on the average, were 20 percent below their respective industry averages
- 2009: 31 percent below
- 58 percent (7 out of 12) of the sites reduced their DART rate
- 75 percent of the sites had DART rates below their respective industry’s averages
- In 2010, the OSP participating sites decreased their LTCR by 10 percent, from 1.0 in 2009 to 0.9
- 42 percent of the sites reduced their LTCR
Three-Year Results
During the 3-year period 2008-2010, the OSP participating sites achieved a 5 percent reduction in the TCIR, maintained their DART rate at 2.8, and experienced an increase of 13 percent with their LTCR.
- 2008-2010 TCIR: For the 3-year period, the OSP participating sites achieved a TCIR of 13.2
- The sites’ three-year TCIR rates, on the average, were 80 percent above the industry averages
- 2007-2009: 94 percent above
- 1 site had its three-year TCIR below its industry’s averages
- 2008-2010 DART: For the 3-year period, the OSP participating sites achieved a DART rate of 3.0
- The sites’ three-year DART rates, on the average, were 6 percent below the industry averages
- 2007-2009: 5 percent above
- 8 sites’ 3-year average DART rates were below their respective industry’s average
- 2009’s evaluation had 5 sites with 3-year DART rates (2007-2009) below their respective industry’s average
- 2008-2010 LTCR: For the 3-year period, the OSP participating achieved a LTCR of 0.9
- 2007-2009 LTCR: 0.9
The three-year incidence rates as measured in the 2008-2010 period were lower compared to the previous 2007-2009 results.
- TCIR: 15.0 (2007-2009) vs. 8.4 (2008-2010) = 44% improvement
- DART: 3.9 (2007-2009) vs. 2.7 (2008-2010) = 33% improvement
- LTCR: 0.9 (2007-2009) vs. 0.6 (2008-2010) = 33% improvement
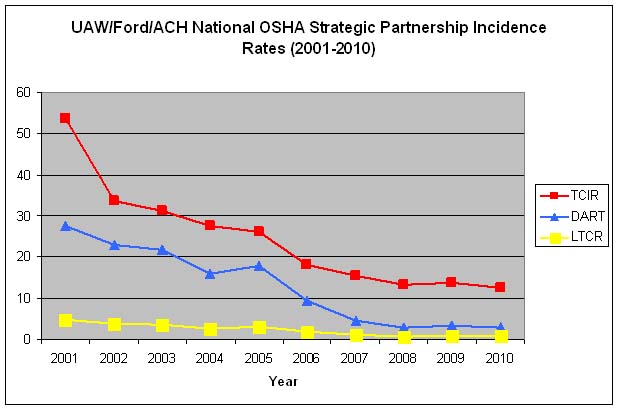
Graph 1 looks at the OSP participating sites incidence rates, as reported by each year’s annual evaluation, over the lifetime of the OSP, from 2001 to 2010. Since the first year of OSP data collection in 2001, the TCIR, DART and LTCR rates for the OSP participating sites have decreased as follows:
- TCIR by 78 percent (57.7 in 2001 to 12.6 in 2010)
- DART by 90 percent (27.5 in 2001 to 2.8 in 2010)
- LTCR by 82 percent (4.9 in 2001 to 0.9 in 2010)
Graph 1
Introduction to Graphs
The following graphs show results for each OSP participating site in 2010. The sites’ names are abbreviated to correspond to those following each site’s name on page 1 of this Annual Evaluation Report.
Graphs 2 (TCIR), 3 (DART), and 4 (LTCR) illustrate the percentage change between 2009 and 2010 for the particular measure. For example, a bar at -20% means that the site reduced its rate by 20% over the course of the year.
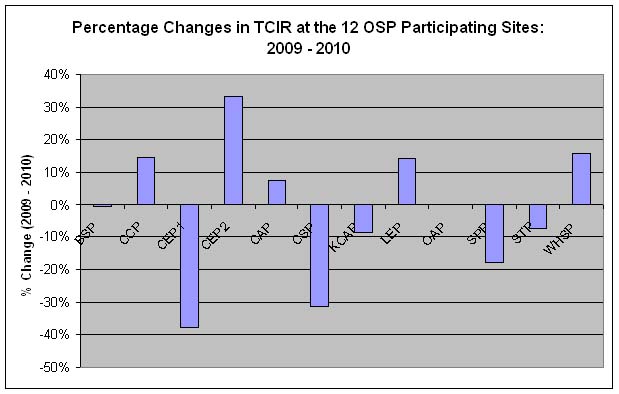
Graph 2
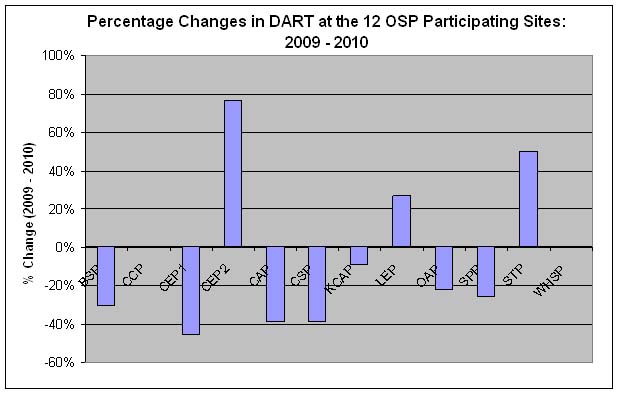
Graph 3
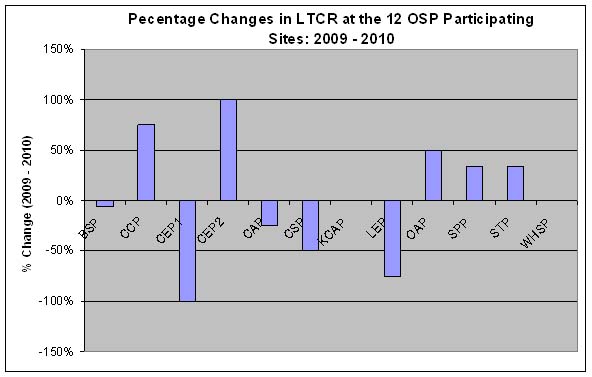
Graph 4
Graphs 5 (TCIR) and 6 (DART) demonstrate each site’s 1-year and 3-year TCIR and DART rates compare to their respective 2009 industry average rates published by the BLS. For example, a bar at 250% means that the site’s rate is 250% higher than its respective industry average.
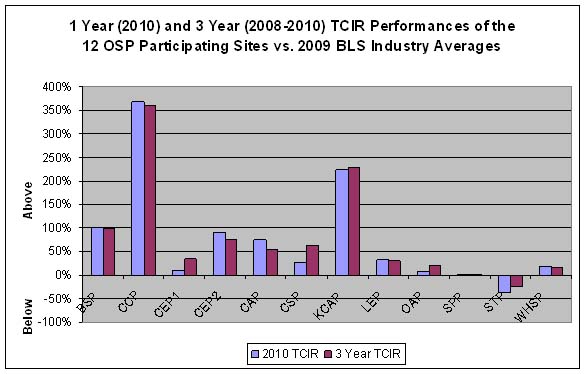
Graph 5
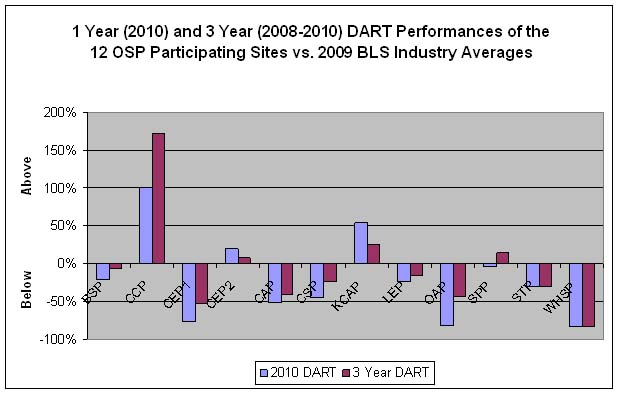
Graph 6
Section 4 Partnership Plans, Benefits, and Recommendations
| Changes and Challenges (check all applicable) | ||
|---|---|---|
|
Changes |
Challenges |
Management Structure |
X |
|
Participants |
|
|
Data Collection |
X |
X |
Employee Involvement |
|
|
OSHA Enforcement Inspection |
|
X |
Partnership Outreach |
|
|
Training |
|
|
Other (Specify) |
|
|
Comments |
||
Data collection continues to present a challenge. As there are 12 sites from which data must be collected, the OSP needs to develop a consistent and systematic approach to collect data. It is recommended that a data collection template be developed should the Agency sign a new OSP agreement. The template would allow for consistency in the data collection process among the individual sites. Also, all parties, including the individual sites, need to be aware of their data collection responsibilities, which for the purpose of this annual evaluation would include training information (number of sessions, number of employees attending, and number of hours), and self-inspections/ hazards identified and abated totals. In late 2010, John Lawson replaced John Bokuniewicz as Ford’s OSP lead. Enforcement inspections were a challenge in 2010 as three out of five inspections conducted resulted in at least one citation. One case was still open at the time this report was prepared. Four of the five inspections were either responses to complaints or referrals. |
||
| Plans to Improve (check all applicable) | ||
|---|---|---|
|
Improvements |
N/A |
Meet more often |
|
|
Improve data collection |
X |
|
Conduct more training |
|
|
Change goals |
|
|
Comments |
||
See Changes and Challenges for a discussion on the data collection issue and recommendations to improve. |
||
| Partnership Benefits (check all applicable) | |
|---|---|
Increased safety and health awareness |
X |
Improved relationship with OSHA |
X |
Improved relationship with employers |
|
Improved relationship with employees or unions |
|
Increased number of participants |
|
Other (specify) |
|
Comments |
|
The OSP participants have experienced significant reductions in the overall injury and illness rates since the inception of the OSP in 2000. UAW, Ford and ACH continue to enhance their safety and health management efforts with the usage of its SHARP assessment processes and will continue to do so using the new system, SOS which will replace SHARP. There have been increased emphases placed on serious injury prevention, ergonomics and machine guarding. Ford has allocated many resources to address these issues, thereby creating a safer environment for its workers. |
|
| Status Recommendations (check one) | |
|---|---|
Partnership Completed |
|
Continue/Renew |
X |
Continue with the following provisions |
|
Terminate (provide explanation) |
|