
Slide 2 « Previous Next »
TEXT VERSION OF SLIDE:
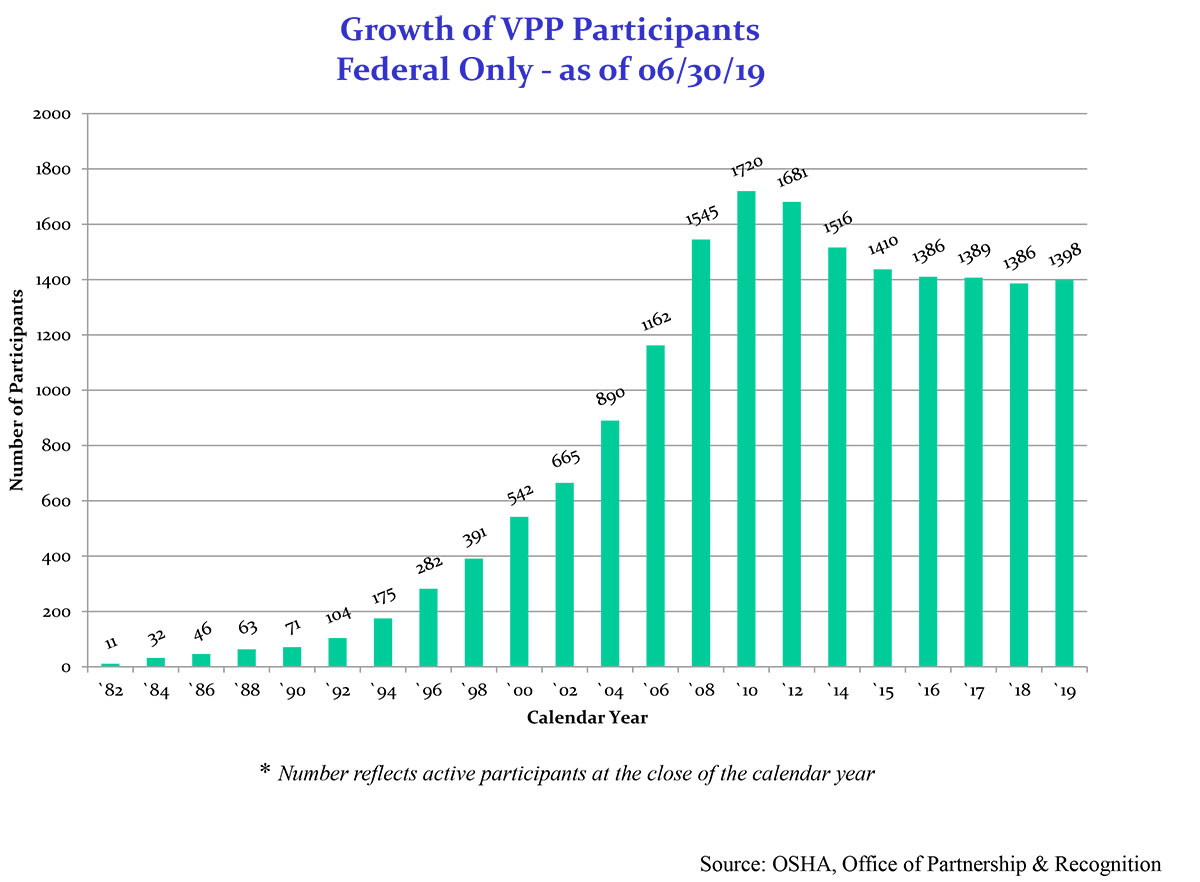
Chart Title: Growth of VPP Participants - Federal Only -- As of 06/30/19
Chart Type: Vertical Bar by Calendar Year
Chart Elements: 22 - One bar for each two years with number of VPP sites.
Values:
- 1982 = 11
- 1984 = 32
- 1986 = 46
- 1988 = 63
- 1990 = 71
- 1992 = 104
- 1994 = 175
- 1996 = 282
- 1998 = 391
- 2000 = 542
- 2002 = 665
- 2004 = 890
- 2006 = 1162
- 2008 = 1545
- 2010 = 1720
- 2012 = 1681
- 2014 = 1516
- 2015 = 1410
- 2016 = 1386
- 2017 = 1389
- 2018 = 1386
- 2019 = 1398
* Number reflects active participants at the close of the calendar year
Source: OSHA, Office of Partnerships & Recognition
Slide 3 « Previous Next »
TEXT VERSION OF SLIDE:
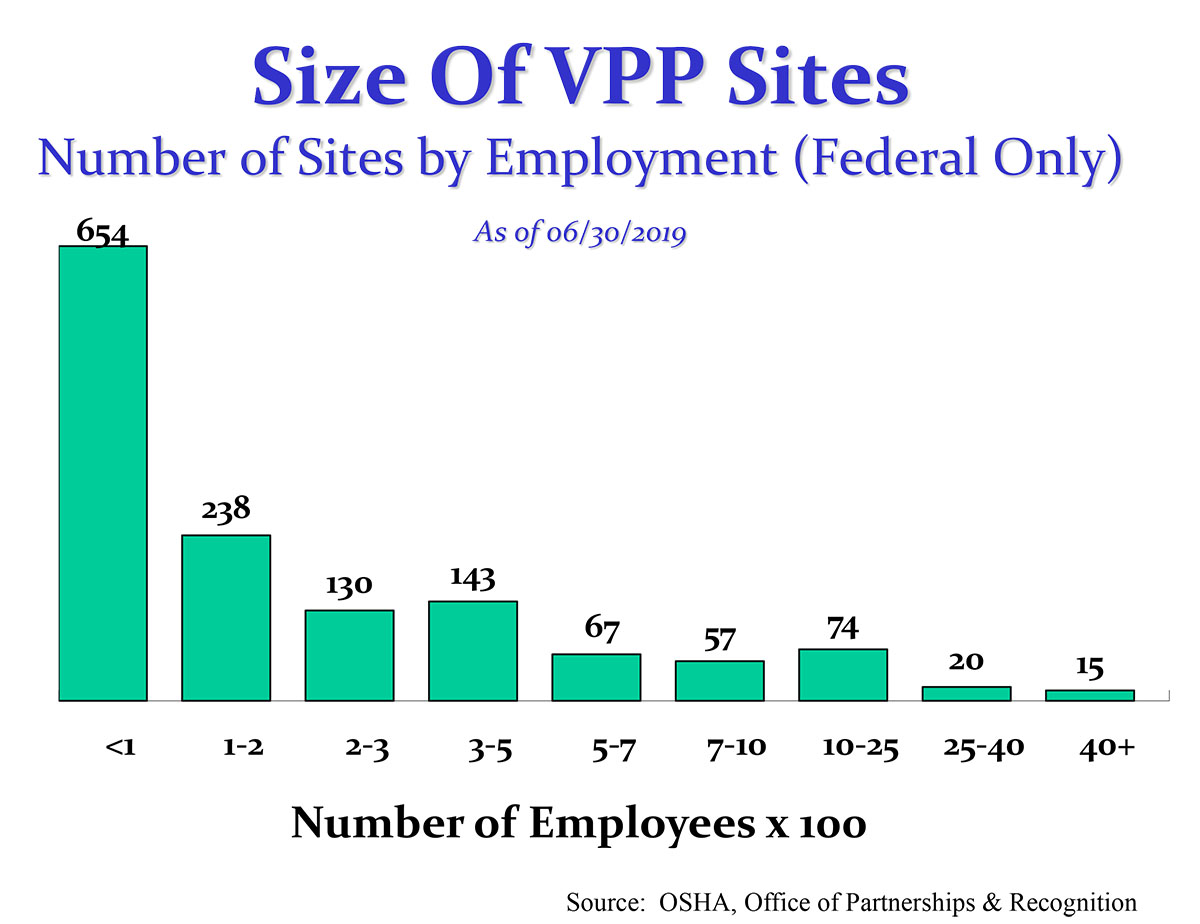
Chart Title: Size of VPP Sites - Number of Sites by Employment (Federal Only) As of 06/30/19
Chart Type: Vertical Bar by Number of Employees x 100
Chart Elements: 9 - One bar for each employee range with number of VPP sites.
Values:
- <1 = 654
- 1-2 = 238
- 2-3 = 130
- 3-5 = 143
- 5-7 = 67
- 7-10 = 57
- 10-25 = 74
- 25-40 = 20
- 40+ = 15
Number of Employees x 100
Source: OSHA, Office of Partnerships & Recognition
Slide 4 « Previous Next »
TEXT VERSION OF SLIDE:
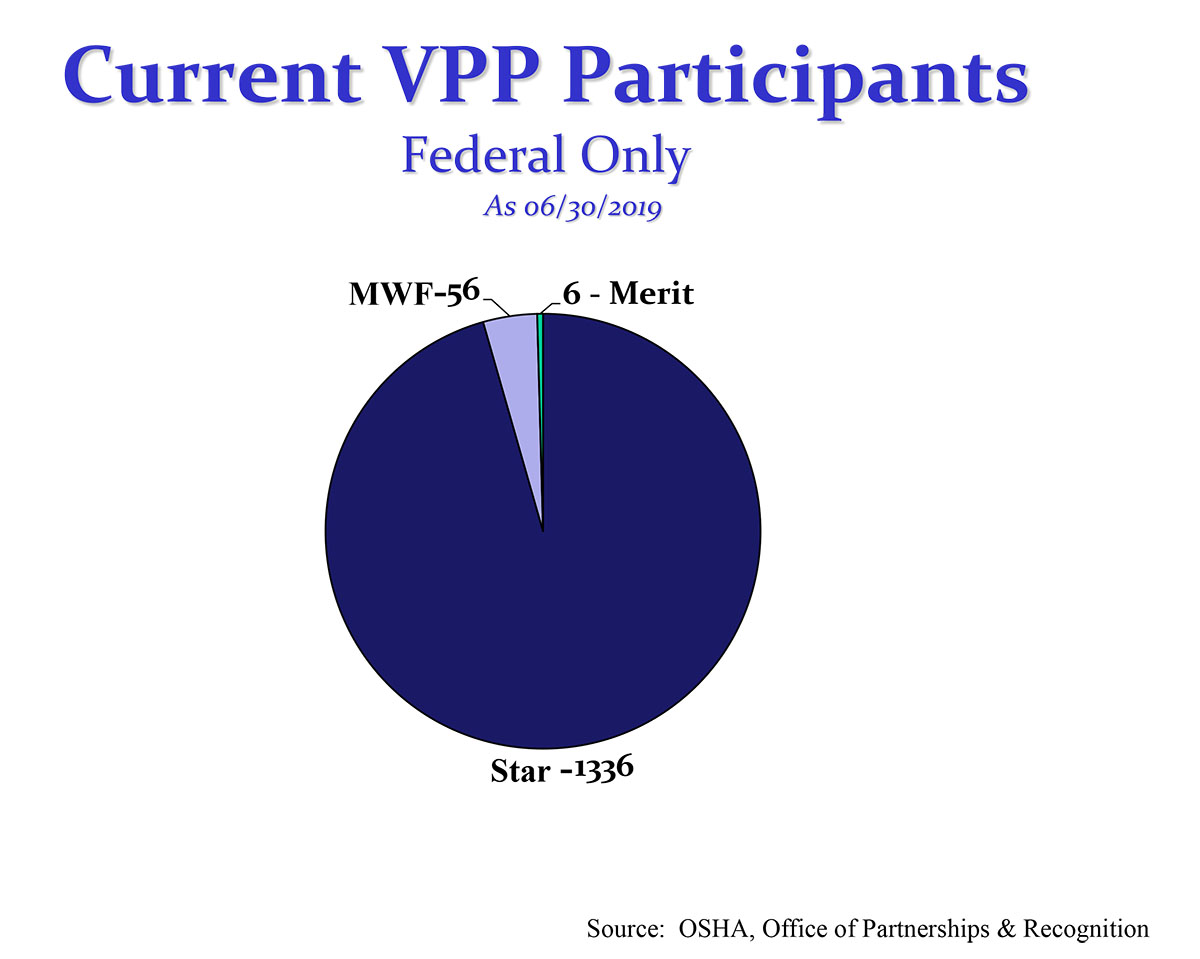
Chart Title: Current VPP Participants - Federal Only -- As of 06/30/19
Chart Type: Pie Chart
Chart Elements: 3 - One segment for each type of program showing the number of participants.
Values:
- Star = 1336
- Merit = 6
- MWF = 56
Source: OSHA, Office of Partnerships & Recognition
Slide 5 « Previous Next »
TEXT VERSION OF SLIDE:
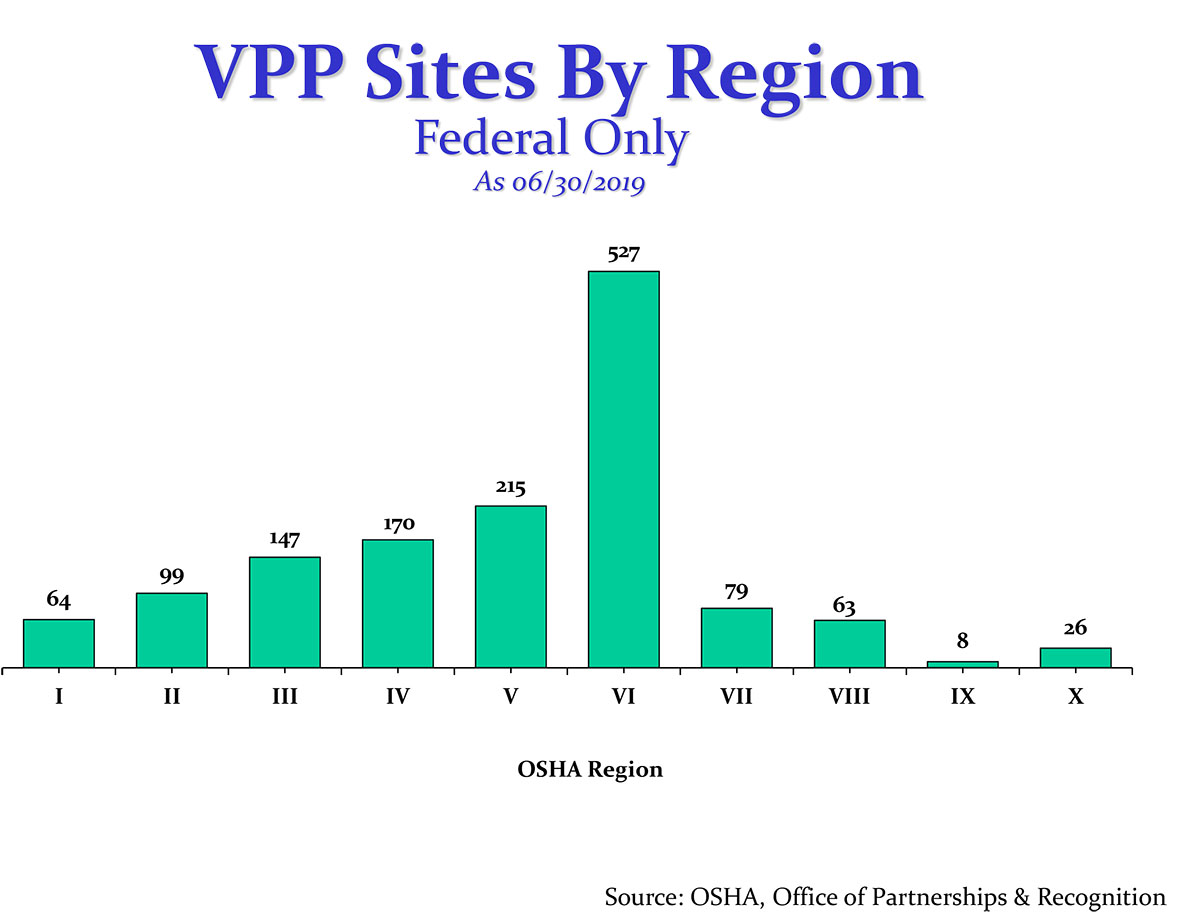
Chart Title: VPP Sites By Region - Federal Only -- As of 06/30/19
Chart Type: Vertical Bar
Chart Elements: 10 - One bar for each OSHA Region with number of VPP sites.
Values:
- Region I = 64
- Region II = 99
- Region III = 147
- Region IV = 170
- Region V = 215
- Region VI = 527
- Region VII = 79
- Region VIII = 63
- Region IX = 8
- Region X = 26
Source: OSHA, Office of Partnerships & Recognition
Slide 6 « Previous Next »
TEXT VERSION OF SLIDE:
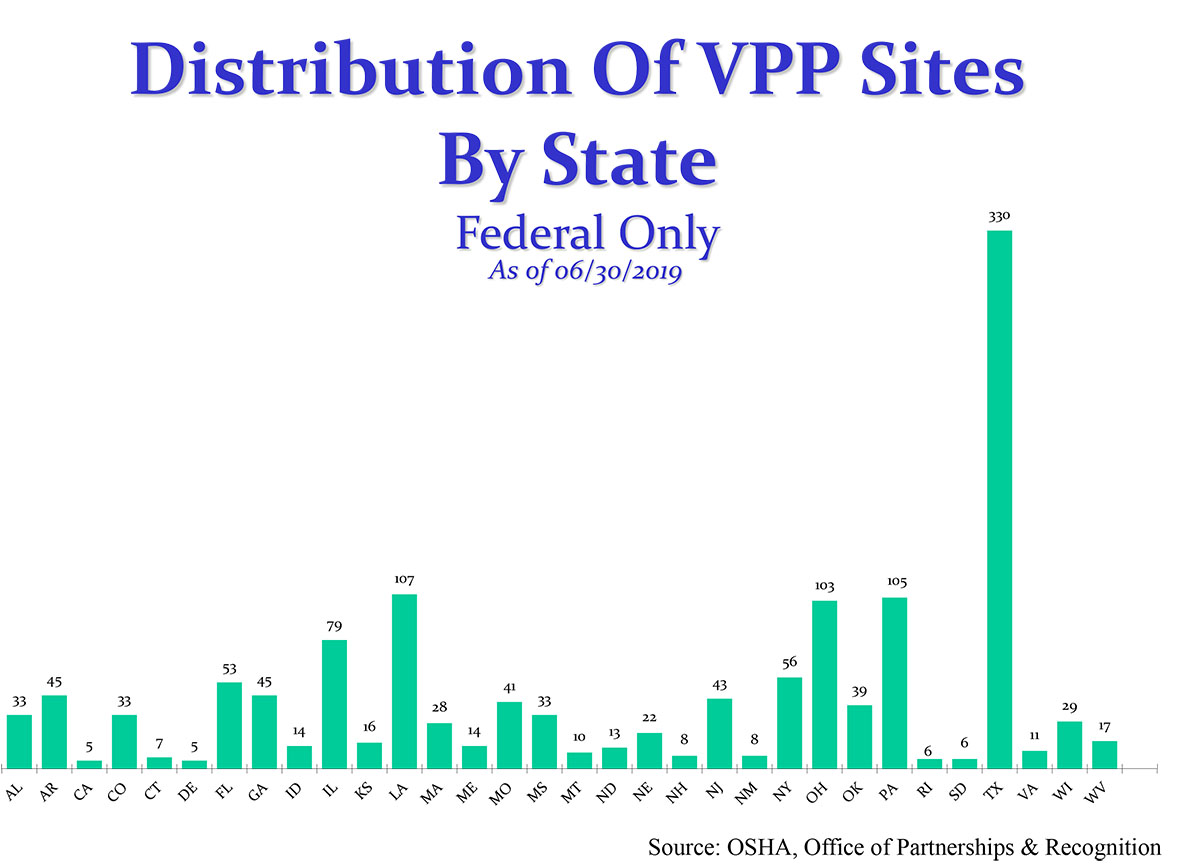
Chart Title: Distribution of VPP Sites By State - Federal Only -- As of 06/30/19
Chart Type: Vertical Bar by State
Chart Elements: 32 - One bar for each State with number of VPP sites.
Values:
- AL = 33
- AR = 45
- CA = 5
- CO = 33
- CT = 7
- DE = 5
- FL = 53
- GA = 45
- ID = 14
- IL = 79
- KS = 16
- LA = 107
- MA = 28
- ME = 14
- MO = 41
- MS = 33
- MT = 10
- ND = 13
- NE = 22
- NH = 8
- NJ = 43
- NM = 8
- NY = 56
- OH = 103
- OK = 39
- PA = 105
- RI = 6
- SD = 6
- TX = 330
- VA = 11
- WI = 29
- WV = 17
Source: OSHA, Office of Partnerships & Recognition
Slide 7 « Previous Next »
TEXT VERSION OF SLIDE:
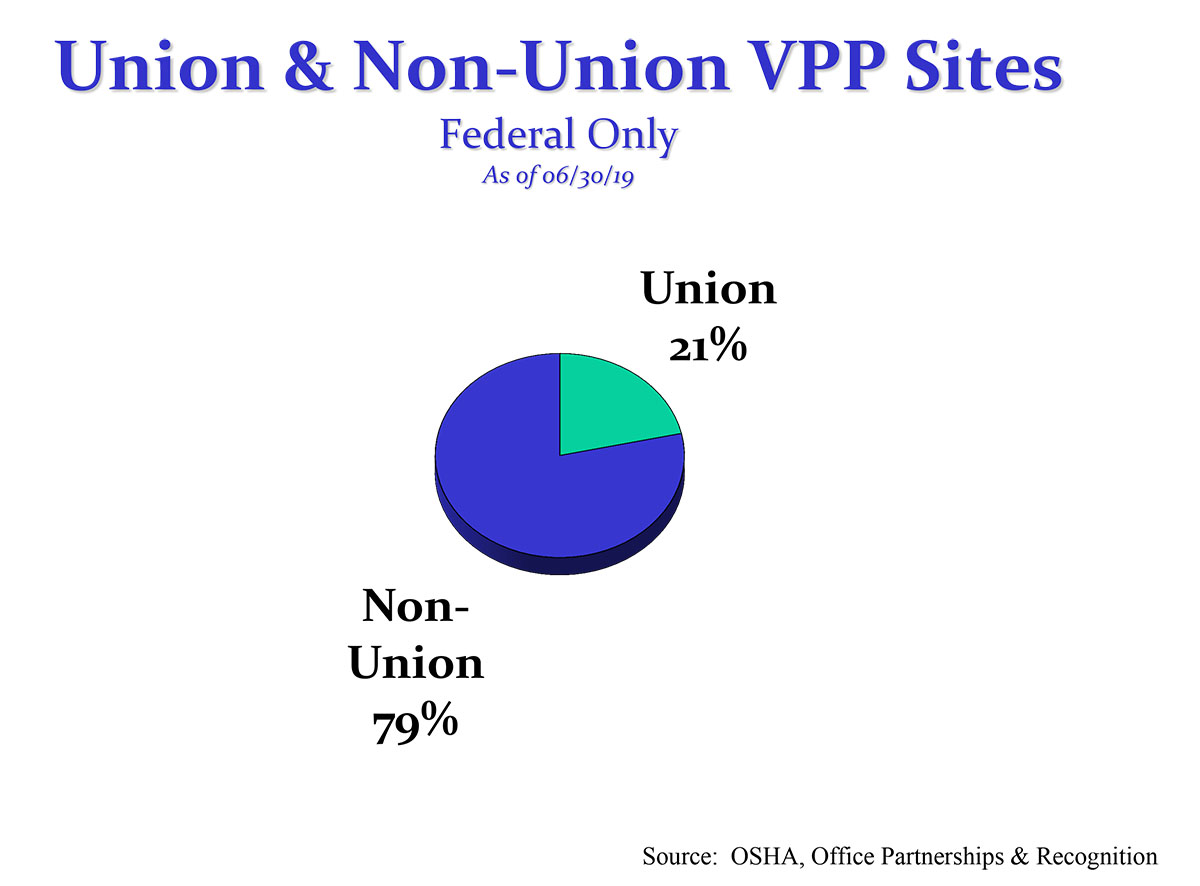
Chart Title: Union & Non-Union VPP Sites - Federal Only -- As of 06/30/19
Chart Type: Pie Chart by Sites
Chart Elements: 2 - Segments based on percentage of VPP sites and type of affiliation.
Values:
- Union = 21%
- Non-Union = 79%
Source: OSHA, Office of Partnerships & Recognition
Slide 8 « Previous Next »
TEXT VERSION OF SLIDE:
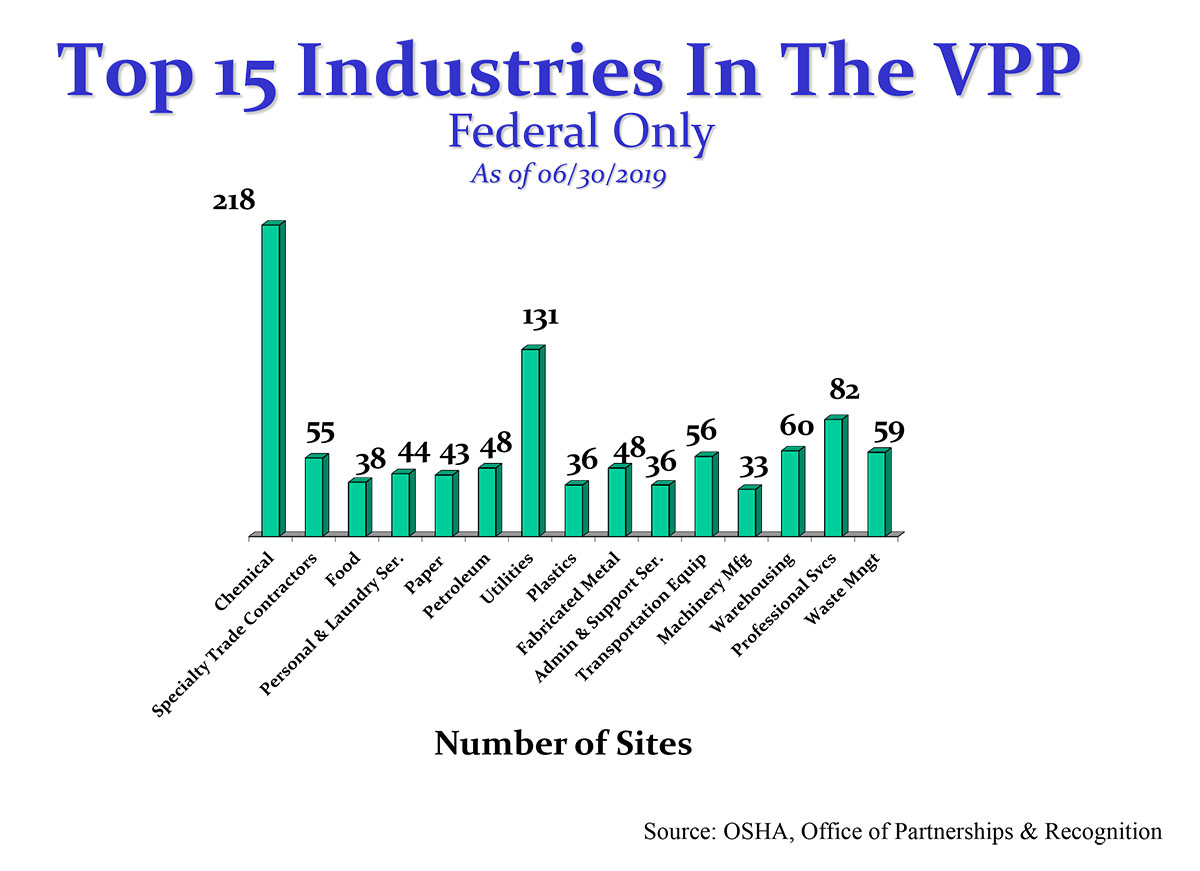
Chart Title: Top 15 Industries In The VPP - Federal Only -- As of 06/30/19
Chart Type: Vertical Bar
Chart Elements: 15 - One bar for each industry type with the number of VPP sites.
Values:
- Chemical = 218
- Specialty Trade Contractors = 55
- Food = 38
- Personal & Laundry Ser. = 44
- Paper = 43
- Petroleum = 48
- Utilities = 131
- Plastics = 36
- Fabricated Metal = 48
- Admin & Support Ser. = 36
- Transportation Equip = 56
- Machinery Mfg = 33
- Warehousing = 60
- Professional Svcs = 82
- Waste Mngt = 59
Source: OSHA, Office of Partnerships & Recognition
Slide 9 « Previous Next »
TEXT VERSION OF SLIDE:
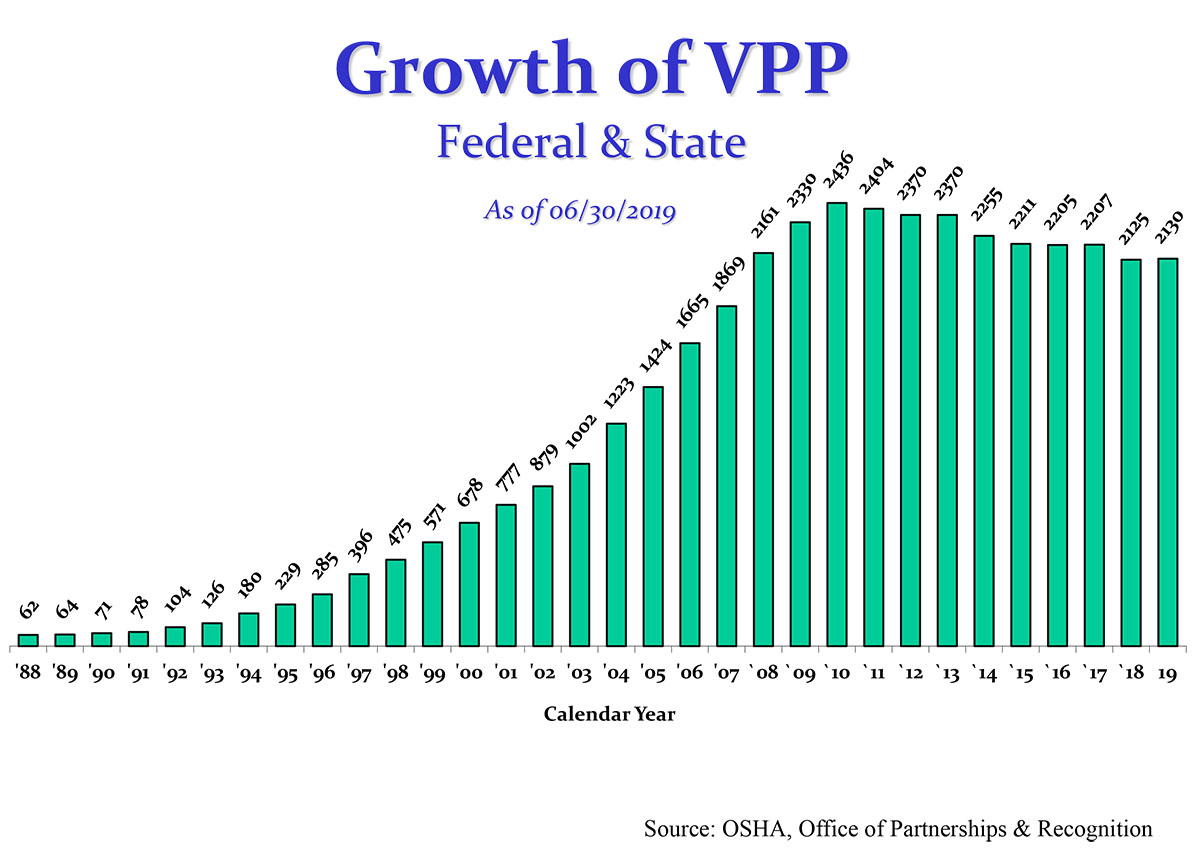
Chart Title: Growth of VPP - Federal & State -- As of 06/30/19
Chart Type: Vertical Bar by Calendar Year
Chart Elements: 31 - One bar for each year with number of VPP sites.
Values:
- 1988 = 62
- 1989 = 64
- 1990 = 71
- 1991 = 78
- 1992 = 104
- 1993 = 126
- 1994 = 180
- 1995 = 229
- 1996 = 285
- 1997 = 396
- 1998 = 475
- 1999 = 571
- 2000 = 678
- 2001 = 777
- 2002 = 879
- 2003 = 1002
- 2004 = 1223
- 2005 = 1424
- 2006 = 1665
- 2007 = 1869
- 2008 = 2161
- 2009 = 2330
- 2010 = 2436
- 2011 = 2404
- 2012 = 2370
- 2013 = 2370
- 2014 = 2255
- 2015 = 2211
- 2016 = 2205
- 2017 = 2207
- 2018 = 2125
- 2019 = 2130
Source: OSHA, Office of Partnerships & Recognition
Slide 10 « Previous Next »
TEXT VERSION OF SLIDE:
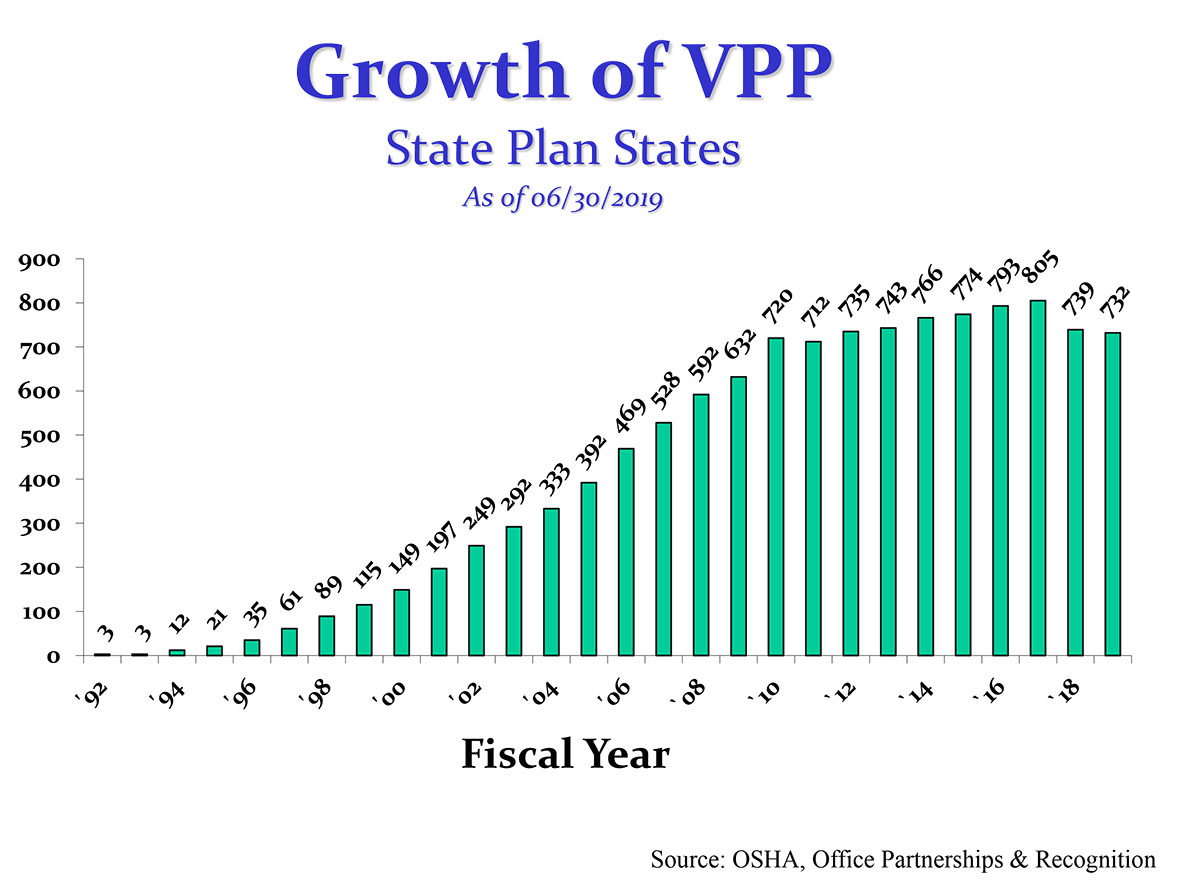
Chart Title: Growth of VPP - State Plan States -- As of 06/30/19
Chart Type: Vertical Bar By Fiscal Year
Chart Elements: 28 - One bar for each fiscal year with number of VPP sites.
Values:
- 1992 = 3
- 1993 = 3
- 1994 = 12
- 1995 = 21
- 1996 = 35
- 1997 = 61
- 1998 = 89
- 1999 = 115
- 2000 = 149
- 2001 = 197
- 2002 = 249
- 2003 = 292
- 2004 = 333
- 2005 = 392
- 2006 = 469
- 2007 = 528
- 2008 = 592
- 2009 = 632
- 2010 = 720
- 2011 = 712
- 2012 = 735
- 2013 = 743
- 2014 = 766
- 2015 = 774
- 2016 = 793
- 2017 = 805
- 2018 = 739
- 2019 = 732
Source: OSHA, Office of Partnerships & Recognition
Slide 11 « Previous Next »
TEXT VERSION OF SLIDE:
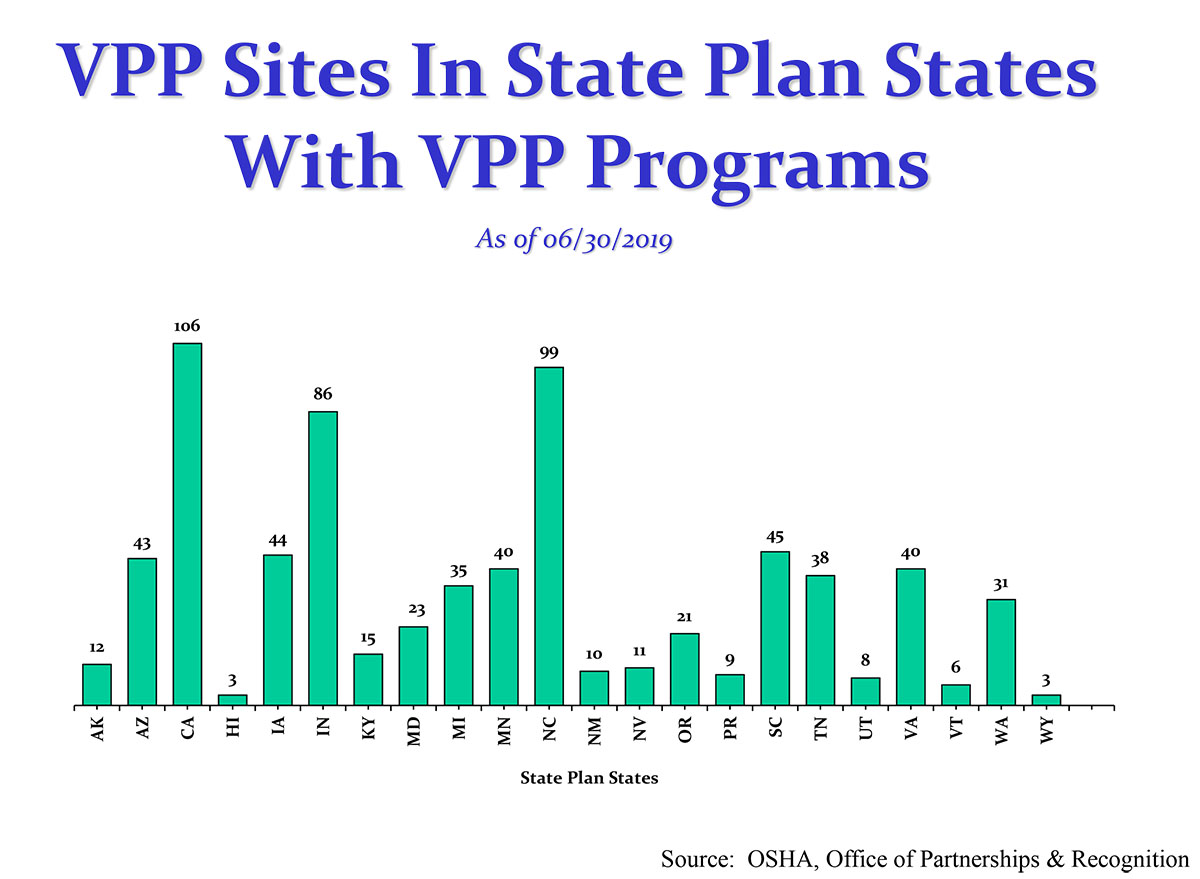
Chart Title: VPP Sites In State Plan States With VPP Programs -- As of 06/30/19
Chart Type: Vertical Bar
Chart Elements: 22 - One bar for each State Plan State with the number of VPP sites.
Values:
- AK = 12
- AZ = 42
- CA = 106
- HI = 3
- IA = 44
- IN = 86
- KY = 15
- MD = 23
- MI = 35
- MN = 40
- NC = 99
- NM = 10
- NV = 11
- OR = 21
- PR = 9
- SC = 45
- TN = 38
- UT = 8
- VA = 40
- VT = 6
- WA = 31
- WY = 3
Source: OSHA, Office of Partnerships & Recognition
Slide 12 « Previous Home
TEXT VERSION OF SLIDE:
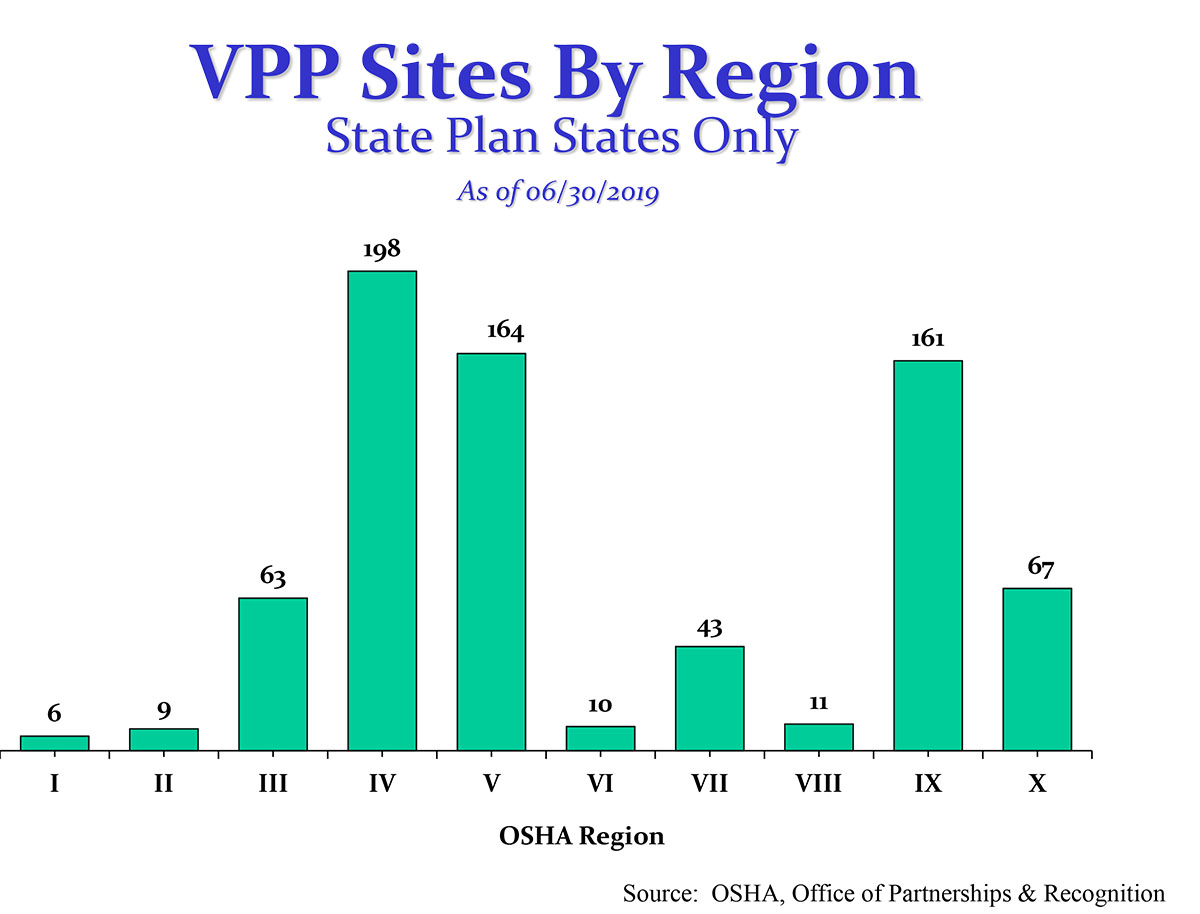
Chart Title: VPP Sites By Region - State Plan State Only -- As of 06/30/19
Chart Type: Vertical Bar
Chart Elements: 10 - One bar for each OSHA Region with number of VPP sites.
Values:
- Region I = 6
- Region II = 9
- Region III = 63
- Region IV = 198
- Region V = 164
- Region VI = 10
- Region VII = 43
- Region VIII = 11
- Region IX = 161
- Region X = 67
Source: OSHA, Office of Partnerships & Recognition