Slide 15
TEXT VERSION OF SLIDE:
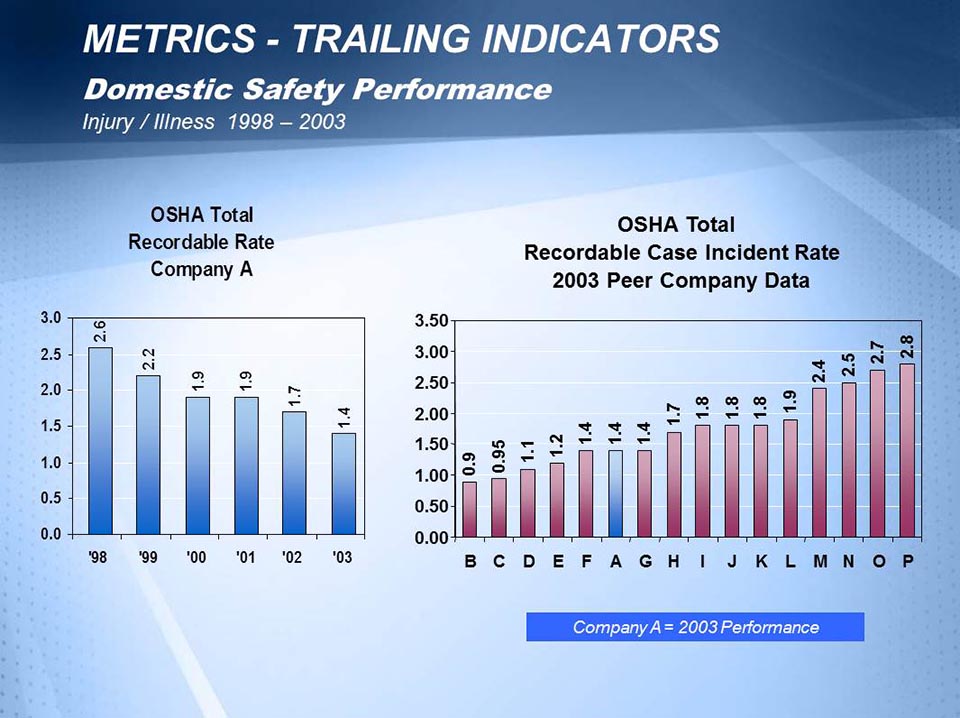
- Title: METRICS - TRAILING INDICATORS - Domestic Safety Performance - Injury / Illness 1998 - 2003
- Type: Text Slide with Two Bar Graphs
- Content:
- Chart One Title: OSHA Total Recordable Rate Company A
- Chart Type: Vertical Bar by Year
- Chart Elements: 6 - One element for each year identifying recordable rate.
- Values:
- '98 = 2.6
- '99 = 2.2
- '00 = 1.9
- '01 = 1.9
- '02 = 1.7
- '03 = 1.4
- Chart Two Title: OSHA Total Recordable Case Incident Rate 2003 Peer Company Data
- Chart Type: Vertical Bar by Rate
- Chart Elements: 16 - One element for peer company identifying recordable case incident rate.
- Note: All companies highlighted in red except Company A which is highlighted in blue.
- Values:
- B = 0.9
- C = 0.95
- D = 1.1
- E = 1.2
- F = 1.4
- A = 1.4
- G = 1.4
- H = 1.7
- I = 1.8
- J = 1.8
- K = 1.8
- L = 1.9
- M = 2.4
- N = 2.5
- O = 2.7
- P = 2.8
Company A = 2003 Performance
- Speaker Notes:
- Example data for management
- Start by conveying a clear message -- GOOD or BAD
- Trend (+) or (-)
- How your performance compares with your peers
- Same industry
- General industry (everyone)
- "Best in Class" organizations
- Example data for management