Slide 17
TEXT VERSION OF SLIDE:
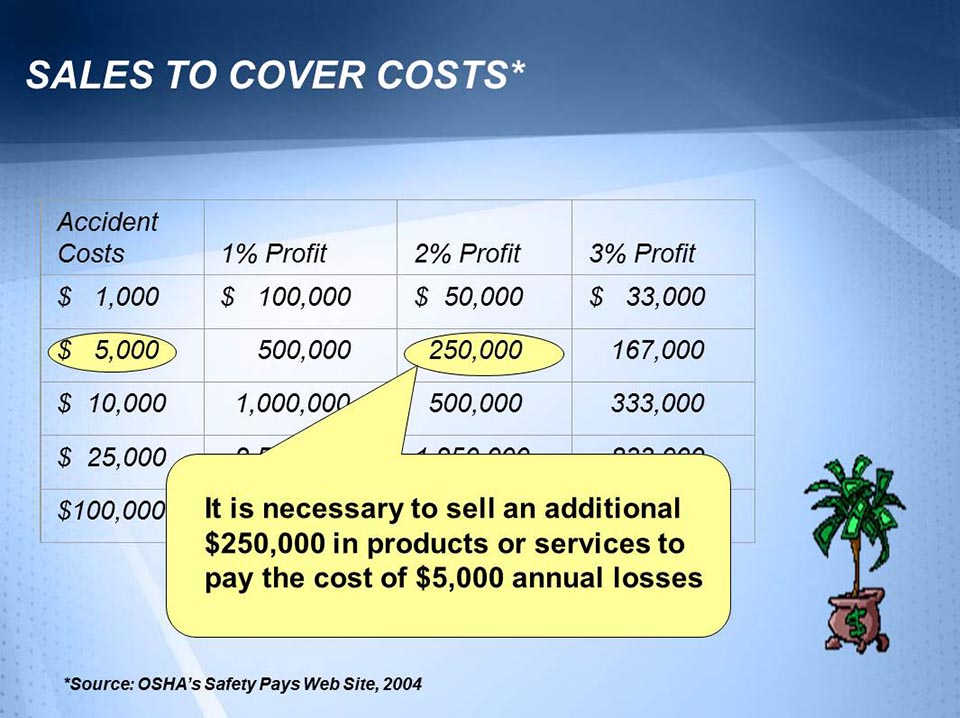
- Title: SALES TO COVER COSTS*
- Type: Data Slide with Images
- Content:
-
Accident Costs 1% Profit 2% Profit 3% Profit $ 1,000 $ 100,000 $ 50,000 $ 33,000 $ 5,000 (circled in yellow) $ 500,000 $ 250,000 (Circled in yellow with note: It is necessary to sell an additional $250,000 in products or services to pay the cost of $5,000 annual losses $ 167,000 $ 10,000 $ 1,000,000 $ 500,000 $ 330,000 $ 25,000 $ 2,500,000 $ 1,250,000 $ 833,000 $ 100,000 $ 10,000,000 $ 5,000,000 $ 3,330,000
-
* Source: OSHA's Safety Pays Web Site, 2004
[Includes clipart image of money tree.]
Speaker Notes:
From the OSHA Safety Pays website.
Another way to view the negative impact of even one accident on the business --
If your profit averages 2% and Direct/Indirect costs total $5,000 then you need an additional 1/4 million dollars in sales to break even --