Slide 64
TEXT VERSION OF SLIDE:
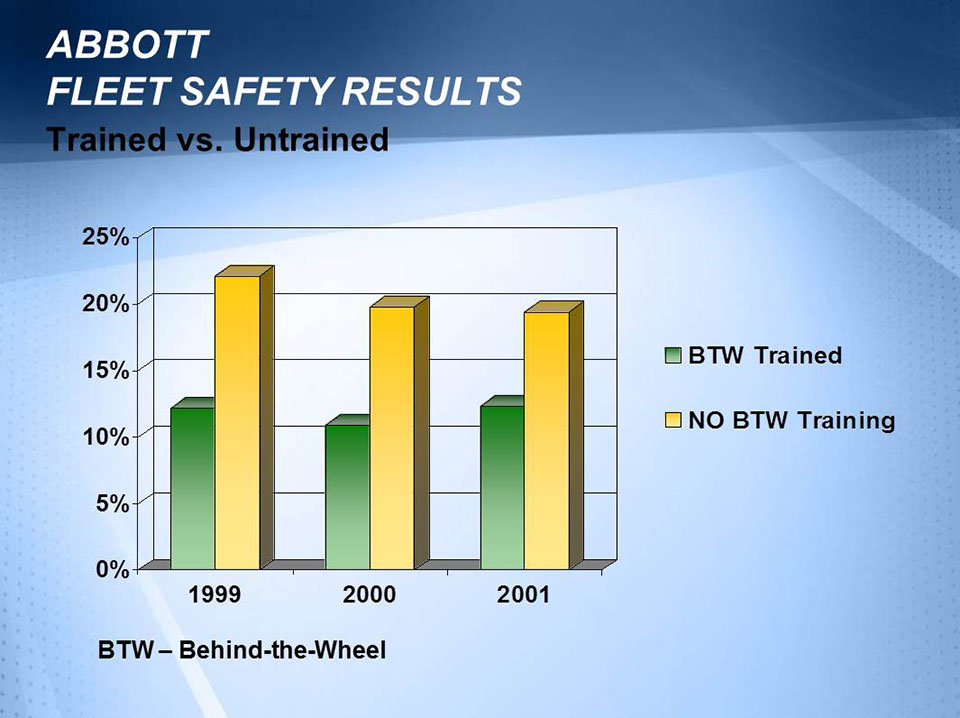
- Title: ABBOTT -- FLEET SAFETY RESULTS, Trained vs. Untrained
- Type: Vertical Bar by Year
- Chart Elements: 3 - One element for each year with two vertical bars; one
(green) for workers Behind-the-Wheel trained, one (yellow) for workers with
no training.
Values:
- 1999
- BTW Trained = 12.20%
- No BTW Training = 22.10%
-
2000
- BTW Trained = 10.90%
- No BTW Training = 19.80%
-
2001
- BTW Trained = 12.30%
- No BTW Training = 19.40%
BTW -- Behind-the-Wheel
Speaker Notes: Prior to 1999 no "Behind the Wheel" training was being provided.
- 1999